Issues with Blue 2-1 After Replacements

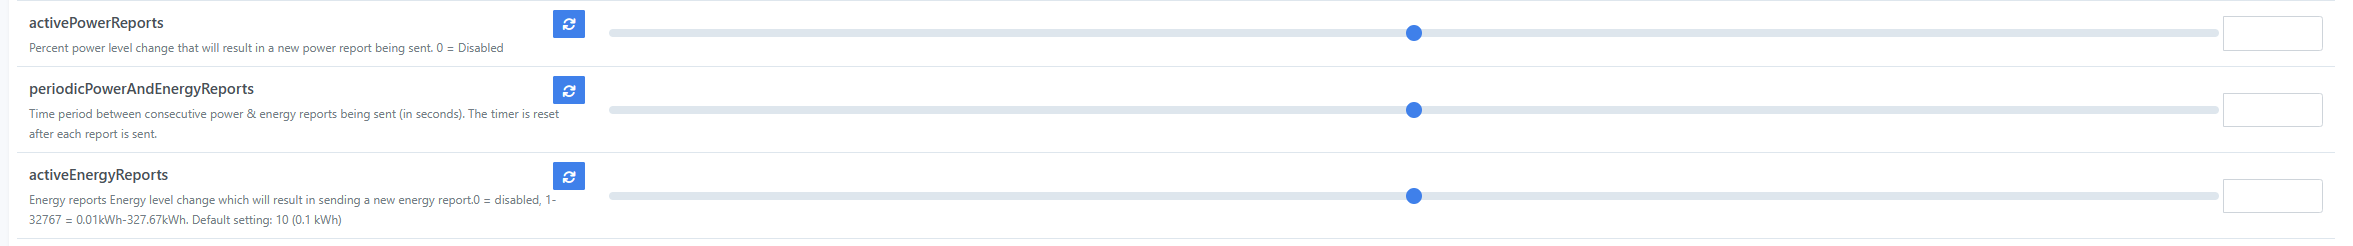
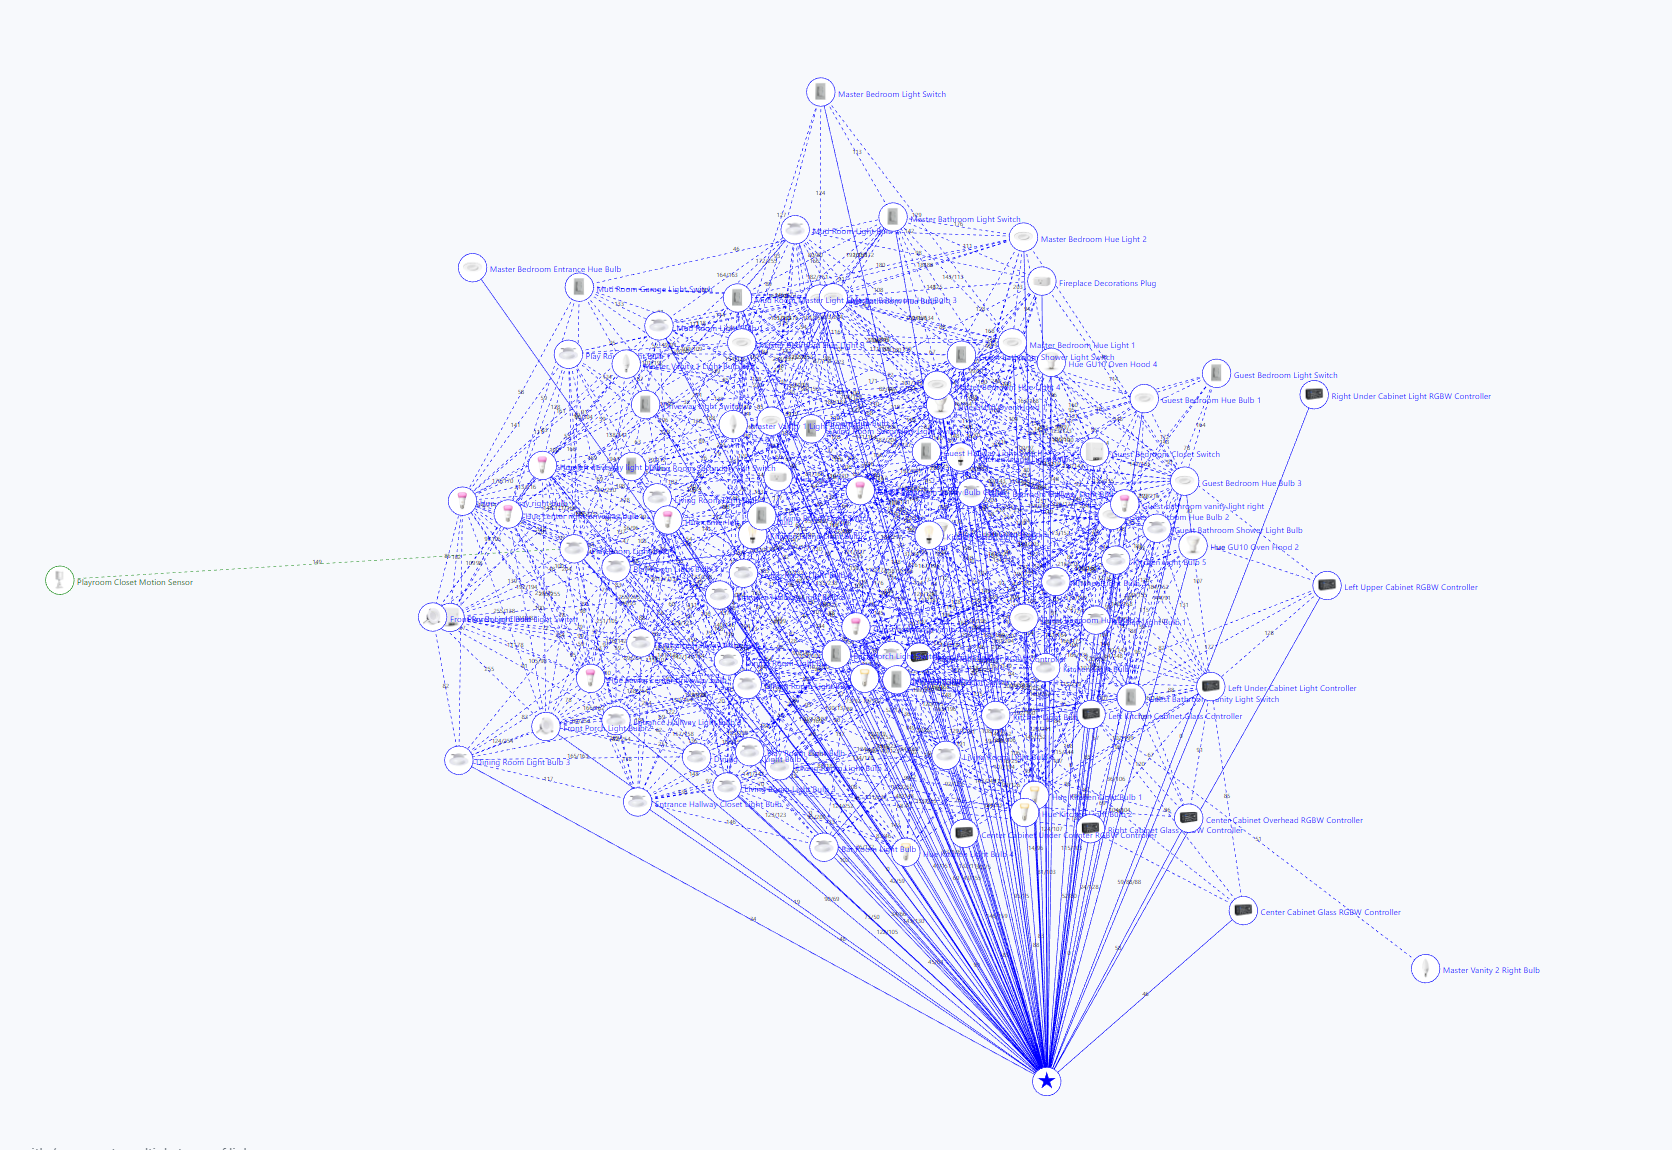
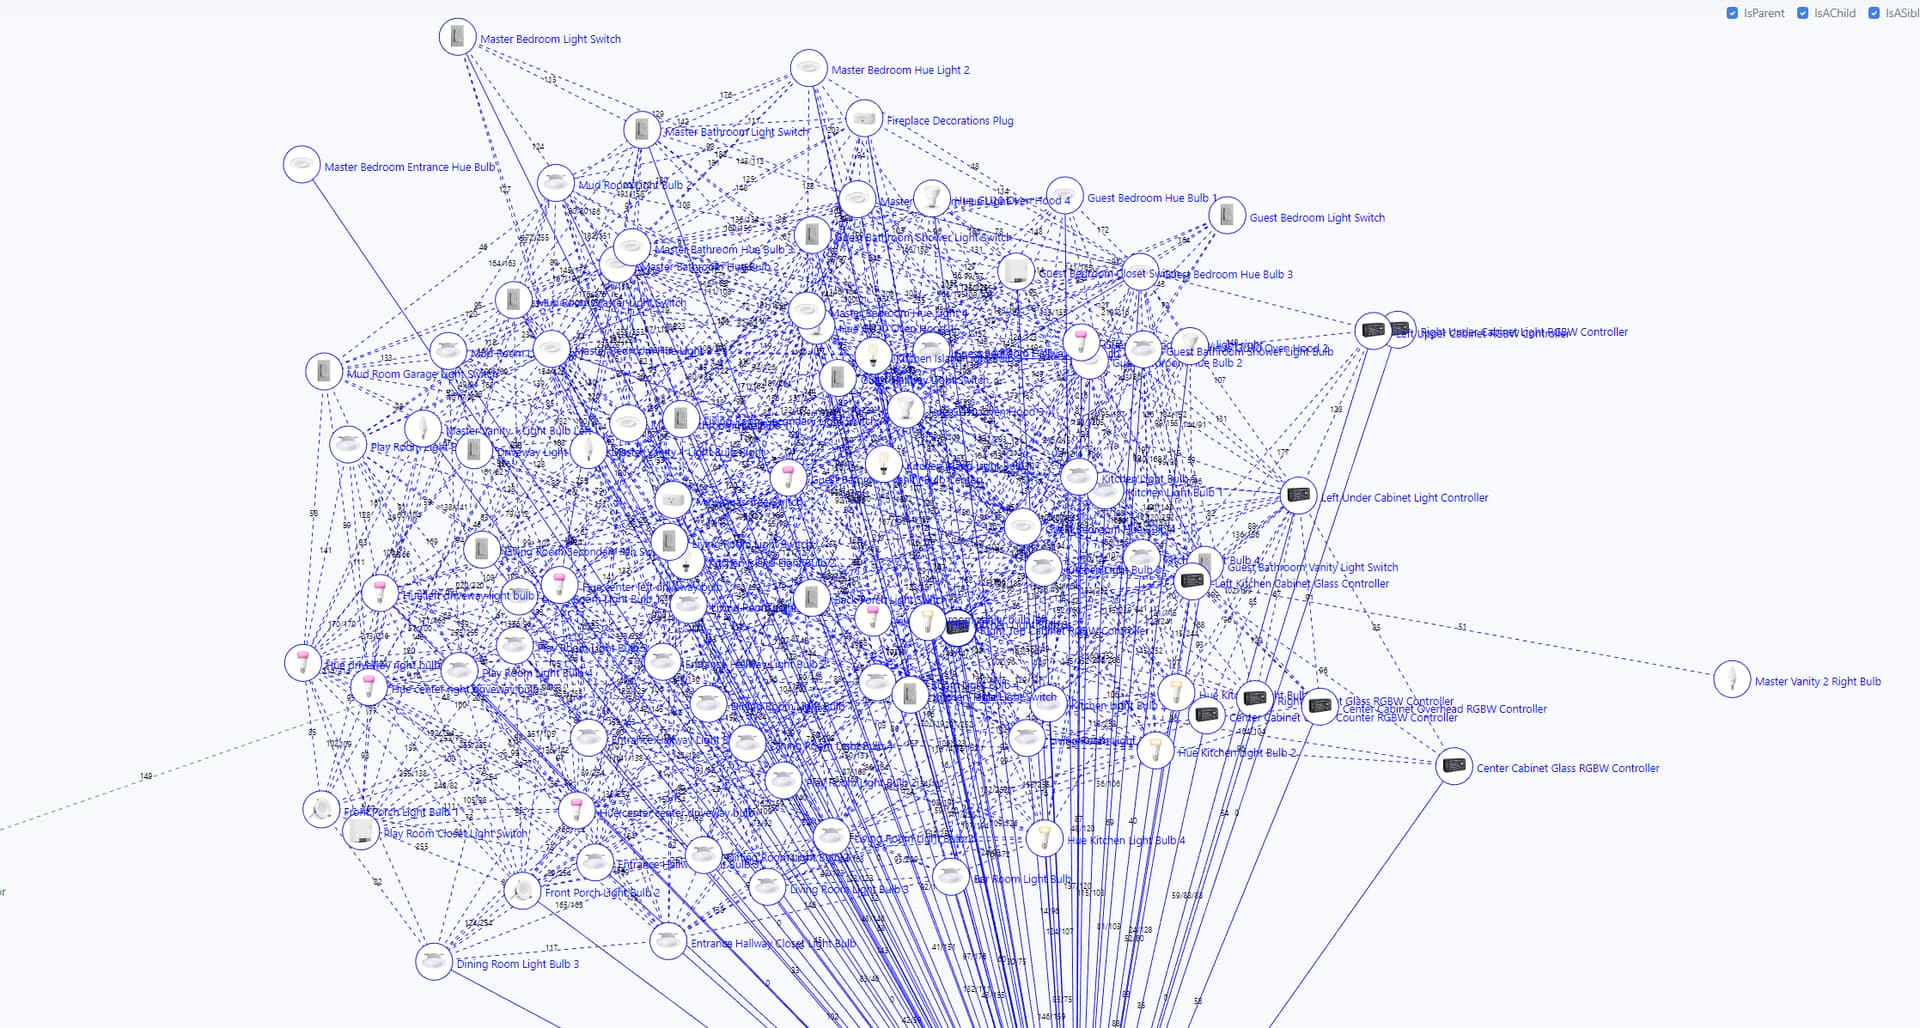
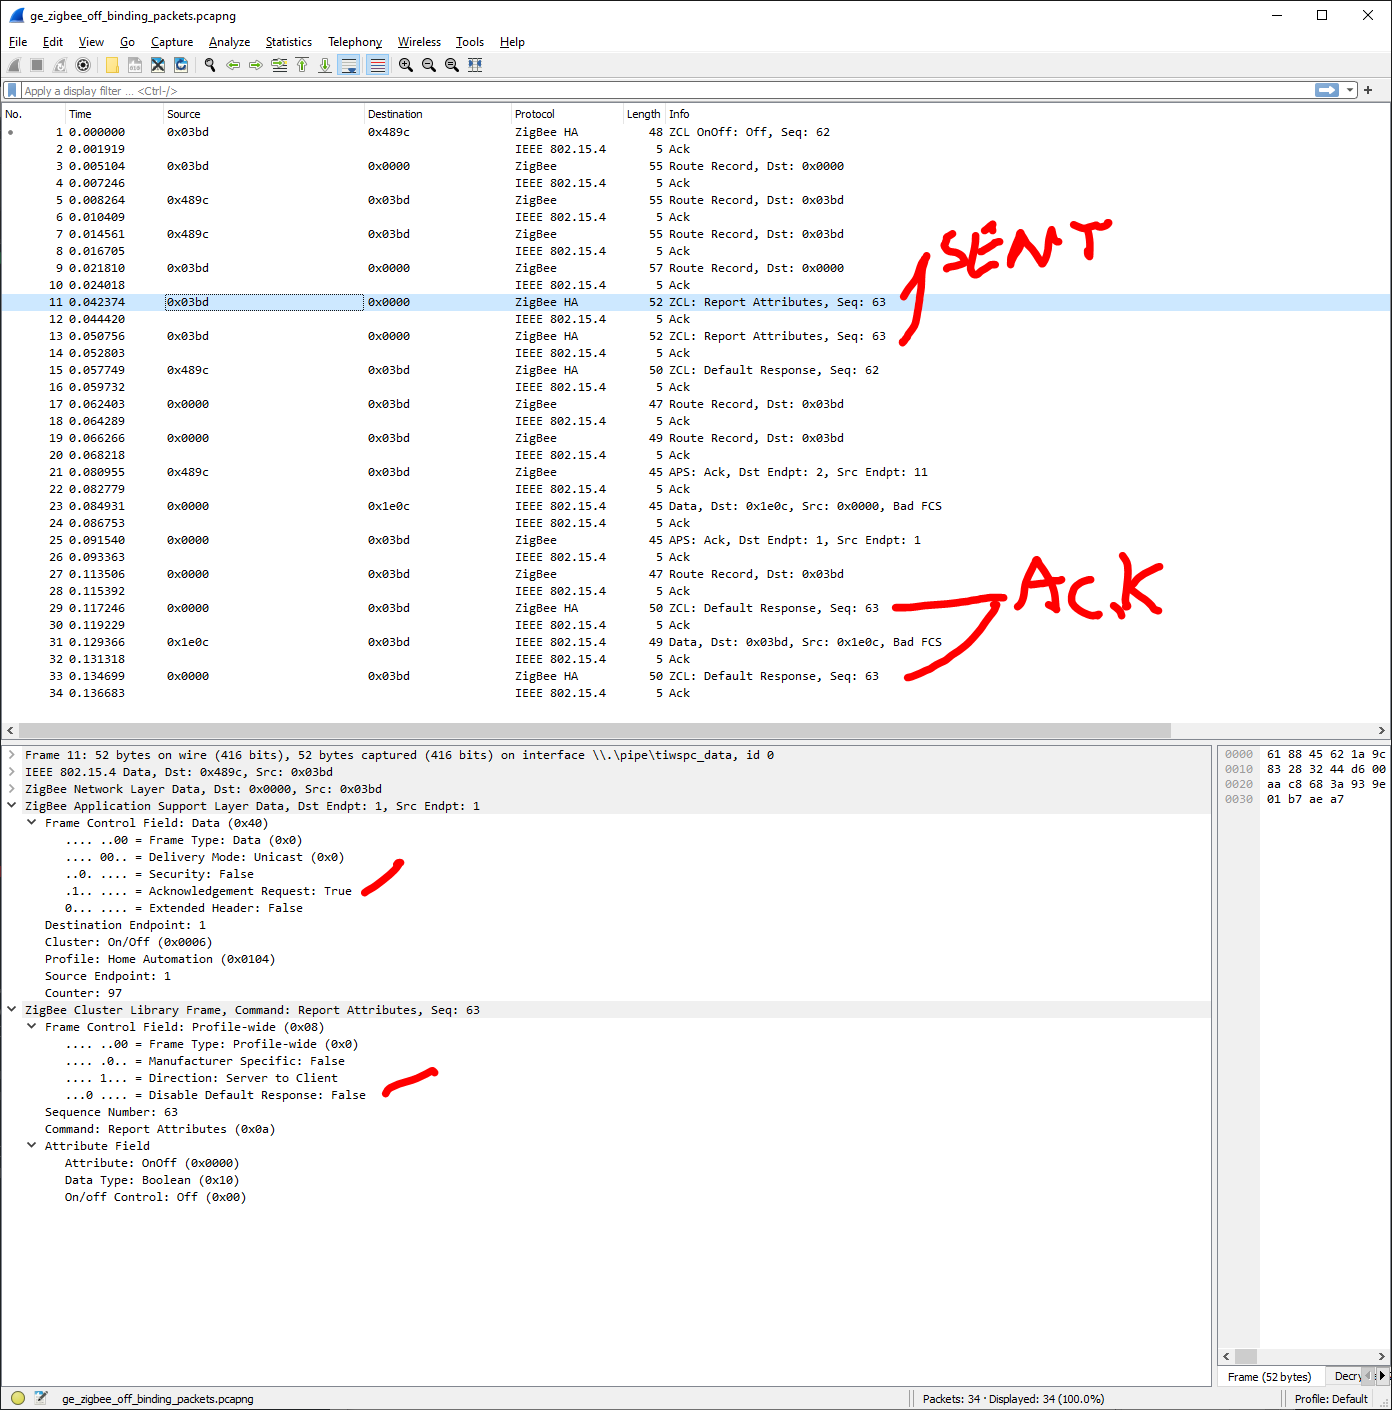
Just received my 50 replacements and started to install them. I wanted to share my experience to see if anyone has any suggestions or has experienced similar issues and to make them known in the event they can be fixed/improved upon. I’ve installed roughly 20 so far. I’m on docker home assistant and docker zigbee2mqtt (1.28.4), using a TubesZB CC2652P router via POE, have tried both 122022 and 021921 Z-stack firmwares. I have 150 devices on my network at this point, 137 being mains powered routers. My network just prior to installing the 20 blue 2-1’s was pretty stable and responsive. I’ve also tried to change energy reporting to 1000 (though sending any changes at this point is very difficult). All switches came with firmware 2.08. Since installing I’ve encountered the following:

  1. My network has become incredibly unstable and can barely interact with anything on the network. Most actions time out and are not able to be performed. Many devices are now falling off the network. Getting Data request failed with error: ‘No network route’ (205), SRSP - AF - dataRequest after 6000ms, Timeout - 57471 - 11 - 12 - 0 - 1 after 10000ms and a few other errors in my logs.

  2. Bound lights (mostly Hue, though also have Eaton/Halo) work about 1/2 of the time and require multiple presses to turn lights off and on. Dimming also is not 1:1 and often it isn’t until after coming off the light switch that the dimming is reflective of the switch.

  3. The Inovelli switches keep falling off the network. Sometimes pulling the air gap and resetting will fix this but not always.

  4. You can not drop the plate for the ground wire in 20% of the switches to actually fit the ground wire into the plate to secure. Tried manipulating the screw and plate but its completely stuck. I ended up having to put the ground under the screw which is less than ideal/secure.

  5. Random resets on some of the switches that are completely unpredictable. As if someone removed air gap and put it back in. I know neutral wiring is not an issue and it appears to occur at random.

Any feedback/thoughts would be really appreciated. Would love to make these work as I’m sure they are capable of. Thanks!

Update: Ended up removing all of them from my network and slowly reintroducing one by one and turning off energy reporting to the best of my ability. This seems to be working at the moment. If continues to be stable by tomorrow I’ll look to try to install more switches and see how it goes.

1 Like

I’ll start by saying I am far from being a Zigbee expert. But with the experience I do have with Zigbee I’d be surprised if you’d be able to get into the 150 device range without having these kind of connection issues.

The CC2652p should be able to handle 50 direct connections and in theory around 200 devices total. So your coordinator should be able to handle it. The issue with large zigbee networks is how the manufacturers implement the zigbee standard.

For example Hue and Ikea use ZLL zigbee protocols, other manufacturers use ZHA zigbee protocols. And while they’re all speaking zigbee, they’re speaking it just a little bit differently. The best way I’ve ever seen this described is comparing it to Americans and Brittish people. They’re all speaking english, and they can mostly understand each other, but sometimes words are said that the other just can’t understand. So if the Brittish device says the baby needs a nappy, the American device may put them down for a nap instead of changing their diaper.

When you’ve got a robust network with lots of repeaters, devices dropping off are usually caused by protocol mismatch. Aqara is famous for this since they don’t really use either protocol properly and if they connect through certain devices that they don’t speak well with, they drop off the network completely. I’ve only got around 100 zigbee devices total and I had to split my network into 2 in order to get it even close to being solid. I have 1 network with only Ikea and Aqara devices, and a second network with everything else including my blue series switches. My second network is about as solid as it can get now. My Ikea/Aqara network still suffers from drop-offs every now and then.

1 Like

Update: I’ve tried two different coordinators just to make sure somehow my coordinator wasn’t having issues and both resulted in the same problems. Air gapping all of the switches resulted in an improvement in my network and it is functional once again. I’m wondering if it is an issue of flooding the network with too much info as mentioned in the other thread especially with as many switches as I have (although I’m still at only 20, was hoping to install 50). @EricM_Inovelli Any thoughts? Can I do any further diagnostic tests to help figure out whats going on? Can this be fixed with firmware? Can I optimize my power reporting to decrease network traffic? Thanks! Next step is to try and separate my network into two to see if this improves performance

1 Like

Hmmm, not sure what is going on here, but let’s see if we can figure it out. Can you ensure that energy reporting is disabled in the device settings?

Set these all to 0:

Then watch the logging for z2m and see if you can find any devices that are “chatty” or any reports of devices timing out? It may also be useful to post a screenshot of your network map from the z2m web interface.

2 Likes

Honestly, I’m even timing out trying to change settings at this point. I had all set to 0 except for periodicPowerAndEnergyReports which I had out to 32676 (maximum value). This is what I get when even trying to change the parameter:

2022-12-27 22:22:15Publish 'set' 'periodicPowerAndEnergyReports' to 'Guest Bathroom Vanity Light Switch' failed: 'Error: Write 0x385b44fffeee12a0/1 manuSpecificInovelliVZM31SN({"19":{"value":0,"type":33}}, {"sendWhen":"immediate","timeout":10000,"disableResponse":false,"disableRecovery":false,"disableDefaultResponse":true,"direction":0,"srcEndpoint":null,"reservedBits":0,"manufacturerCode":4655,"transactionSequenceNumber":null,"writeUndiv":false}) failed (Timeout - 64962 - 1 - 180 - 64561 - 4 after 10000ms)'

This is reflective of almost my entire network at this point. I recently split the network into 2 to decrease the traffic going to the coordinator and am still running into issues. Really appreciate you looking into this!

Update: Here is the error message with each switch as I try and update my settings

2022-12-27 22:26:16Publish 'get' 'periodicPowerAndEnergyReports' to 'Guest Bedroom Light Switch' failed: 'Error: Read 0x94deb8fffe4c340d/1 manuSpecificInovelliVZM31SN(["periodicPowerAndEnergyReports"], {"sendWhen":"immediate","timeout":10000,"disableResponse":false,"disableRecovery":false,"disableDefaultResponse":true,"direction":0,"srcEndpoint":null,"reservedBits":0,"manufacturerCode":4655,"transactionSequenceNumber":null,"writeUndiv":false}) failed (Timeout - 1841 - 1 - 22 - 64561 - 1 after 10000ms)'

2022-12-27 22:26:23Publish 'set' 'periodicPowerAndEnergyReports' to 'Kitchen Table Light Switch' failed: 'Error: Write 0x70ac08fffe71070f/1 manuSpecificInovelliVZM31SN({"19":{"value":0,"type":33}}, {"sendWhen":"immediate","timeout":10000,"disableResponse":false,"disableRecovery":false,"disableDefaultResponse":true,"direction":0,"srcEndpoint":null,"reservedBits":0,"manufacturerCode":4655,"transactionSequenceNumber":null,"writeUndiv":false}) failed (Timeout - 34797 - 1 - 32 - 64561 - 4 after 10000ms)'

Here is network map. Switches are being used to route. This is after splitting and reducing my network from 150>98 devices

So do you see a lot of traffic coming in through the z2m logs? Rebooting z2m doesn’t make any difference at all?

1 Like

There is traffic, with the switches constituting the most but nothing that screams out that I can see (other than the errors as stated above). Rebooting both Z2m and coordinator is not making a difference and continues to give issue. Z2m also has null for all devices in terms of powerType. I’m also wondering if the random resets are causing issue with the stability of the network and whether or not that the lack of powerType is causing any issue. Initially, I thought it was related to the problem with the grounding plate, but even after fixing that by taking the front face of the switch off to free the plate and properly inserting the ground I’m still having resets from most of the switches. I’d really love to know if others not using Z2M with a decent number of blue switches are having the same issues to help isolate the issue.

At this point I’ve also separated my network into two with two separate Z2M instances. Those with the switches result in essentially a non working network. Those without work without issue. At this point if Z2M is the issue I’d be willing to migrate elsewhere. I’m just very thankful that my wife is so understanding :laughing:

I’d be interested if you see the same issue with ZHA. I don’t have near the quantity of devices but this does seem like a z2m handler/function issue, not a switch issue.

I realize that is a LOT of time to set up and also limiting function of the UI.

I’m also curious about this, but hopefully we can figure it out on z2m as well. I personally have not seen this issue on my network, but I am using Hubitat.

@bgreet When the slowdown occurs, are the devices responsive physically? Can you go up to the device and press a button and have things instantly respond? Or do the devices seem to slow down as well?

I’ll pm you with some other questions and we will dig a little more.

All my switches are smartbulb enabled. If I disable smartbulb they are fully responsive. They are also fully responsive at the switch for on/off with smartbulb enabled with binding though the hit rate is 75-80% working on the first try (switch shows that is is off/on or dimmed but does not get sent to bulbs).

1 Like

I have very similar issues as you in a similar setup: ~30 blue switches, Z2M, all controlling Hue bulbs. I, however, split my network into two to reduce the number of devices in each. That cut waaay down on the random errors and general stability, but did not fix binding.

The most frustrating is the binding issues that you note in your (2). I played around with sniffing and documented a bit here, but still need to follow up on that after the holidays.

I wonder if anyone is running blue switches bound to hue lights at a similar scale that is actually having success? From what I’m seeing in my linked thread above, the network flooding appears to be due to the large amount of devices trying to talk over each other with the Blue’s sending a whole lot of broadcast messages.

Also, @bgreet- I see your direct message about setting up a sniffer- I’ll try to get around to replying later today.

edit: I only have about 30 blue switches, not 50… I don’t know why I wrote that at first :upside_down_face:

If you haven’t already, check out changing the interval reporting in z2m (see separate post on the topic regarding flooding). It changed the game with my network including binding. Let me know if that works. I did the same initially (ie splitting network, checking exposure reports to 0) but what made things work was changing the reporting interval. Good luck!

2 Likes

Hey @terrence.bentley – how many Hue do you have? I was able to get 13 bound to a single switch and had that running for a while on my test setup. Granted, I was using ZHA, but I did get it setup on Z2M at least long enough to make a tutorial video.

1 Like

@Eric_Inovelli I have 30 Hue on one network (with ~18 blue series controlling them) and 25 Hue on the other (w/ ~10 blue series).

The most I have bound on a single switch is a group of 6, but I haven’t noticed any correlation in my testing between the # bound to a single switch vs bind reliability. When it works, it works BEAUTIFULLY- immediate response. The broken behavior tends to happen when pressing multiple switches quickly right after each other e.g. the use case of turning off all of the basement lights from a 3 gang bank of switches one after another: I can pretty reliably get at least one of the 3 bindings to fail when doing this. I can also reliably get the binding to fail by quickly toggling a single switch on and off a few times within a few seconds.

I’m not a zigbee expert by any means, but I can’t help but be suspicious of all the broadcast messages the switch sends to all the nodes in the network when the physical switch is pressed. Note that I can toggle on and off my GE zigbee switch bound to a Hue bulb as fast as I can press it and the binding stays reliable (it’s only sending ~4 messages per tap vs the 60+ messages when tapping the Blue series).

Again, I can’t stress enough zigbee is new to me and my “conclusions” about the causes of my poor reliability are pure speculation based on the evidence I’m seeing through my sniffing dongle: I could be way off base here. :slightly_smiling_face:

Makes sense – I think you’re right regarding traffic. I know Eric M is working on something relating to Z2M right now and the energy monitoring to minimize the traffic.

I skimmed back through this thread, so apologies if you’ve answered already, but have you turned off (set to 0) parameters 18, 19, 20 (all the power monitoring ones)? This may help while we work on a solution for Z2M.

Yes- those are all disabled and I have verified they aren’t causing any traffic when sniffing the network.

It’s these OnOff broadcast messages that appear to be the culprit:

Those highlighted messages are all the OnOff attribute messages being broadcast across the network to every node (note that these messages have nothing to do with the energy monitoring- these are specifically OnOff and/or LevelCtrl messages being broadcast).

Is it Z2M that would responsible for these OnOff broadcast messages when interacting with the switch or is it the firmware of the switch itself? I guess I would have assumed the latter, but I don’t have an easy way to test the message behavior in ZHA at the moment.

3 Likes

Interesting, thanks for documenting this - I’ll unfortunately have to defer to @EricM_Inovelli on this one :confused:

1 Like

From that trace, it looks like it tried to send a response to the coordinator (19963, sequence 29) but perhaps didn’t get a response. Then it starts broadcasting seq 29 to all nodes every 0.00250 seconds or so, perhaps in a panic mode of trying to get that packet back to the coordinator using an alternate route?

A trace of where that node is either source or destination may help figure that out.

1 Like

Ah, you may be on to something, @coreystup !

Here are two downloadable packet dumps from wireshark (you’ll obviously need the wireshark application to open these): one for the traffic on the inovelli blue switch and one for the traffic on the GE/Jasco zigbee switch (acting somewhat as a control). Both experiments were run by binding each switch to the same single Hue bulb and pressing either up or down on the respective paddle and monitoring the traffic. Both of these dumps start with the initial packet being sent from the switch to the bulb and ends when the traffic tails off. The GE switch generates a total of 34 packets (none being of the broadcast type) over 0.1 seconds, while the Inovelli generates 213 (133 being broadcast) packets over 1.8 seconds.

I’m honestly unsure of exactly how to interpret all of these packets, but I can spot some differences between the GE vs Inovelli packets that may be worth noting:

Starting with the GE:


We can see it send a packet (two of the same actually- redundancy?) to the coordinator at .04s to tell it the new state of the switch (Off) with flags of: “acknowledge request” = True and a “Disable Default Response” = False.

Then, at .11s:

We can see the coordinator sending back a “ZCL: Default Response” of “Success”. Presumably letting the switch know that it received the packet and all is good.

Now, moving to the Inovelli:


We can see the same type of reporting packet sent to the coordinator at .05s with flags: “acknowledge request” = True, but (in contrast to the GE) with a “Disable Default Response” = True as well. Is this telling the coordinator that it’s expecting an acknowledgement, but at the same time telling it not to send a response? Looking through the rest of the packets, we never see the coordinator send back a “ZCL: Default Response” = “Success” message to the inovelli switch (it does send a few things to it that look like route discovery things, but never a “success” message as we saw with the GE switch).

The only odd thing about the “inovelli panics when it doesn’t get a response from the coordinator” hypothesis is that the inovelli only “waits” ~0.04s between sending the packet to the coordinator and then starting its flood of broadcast messages. Whereas the GE switch actually doesn’t even receive its response from the coordinator for about 0.06s after sending its packet to the coordinator.

Anyhow- is this helpful? Again, the technical aspects of zigbee are new to me so I’m grasping at straws a bit here, but just attempting to provide enough info to help troubleshoot this for the folks who are having these issues.

And just to note: these two dumps are not anomalies: this is consistent traffic behavior that I’ve always seen on both the GE switch as well as all of my inovelli switches. I strongly don’t think this has anything to do with a poor mesh/issues in communication. The switches and the Hue bulb in this experiment are all within ~6ft of the coordinator and each other and none of my installed switches are in the bad batches.

edit: oh, and these are the zigbee keys I have configured in wireshark for my networks to be able to see the fully decrypted packets:

“f0:8e:97:53:9c:05:ca:c5:f5:70:0c:28:93:ec:f8:dc”
“5A:69:67:42:65:65:41:6C:6C:69:61:6E:63:65:30:39”
“a38895d224d436924aba8cd7da4f4d9d”
“01030507090b0d0f00020406080a0c0d”

3 Likes